Best AI tools for data visualization in 2026: 8 picks for every budget
From ChatGPT charts to Power BI Copilot and Napkin AI, the eight best AI tools for data visualization in 2026, with prices and who each one suits.
 Written byAlap ZahidReviews and guides editor
Why you can trust The AI Future
Our writers research every product, link each claim to its source and correct mistakes openly. Companies can't pay for coverage or see reviews before they're published.
Read our editorial policy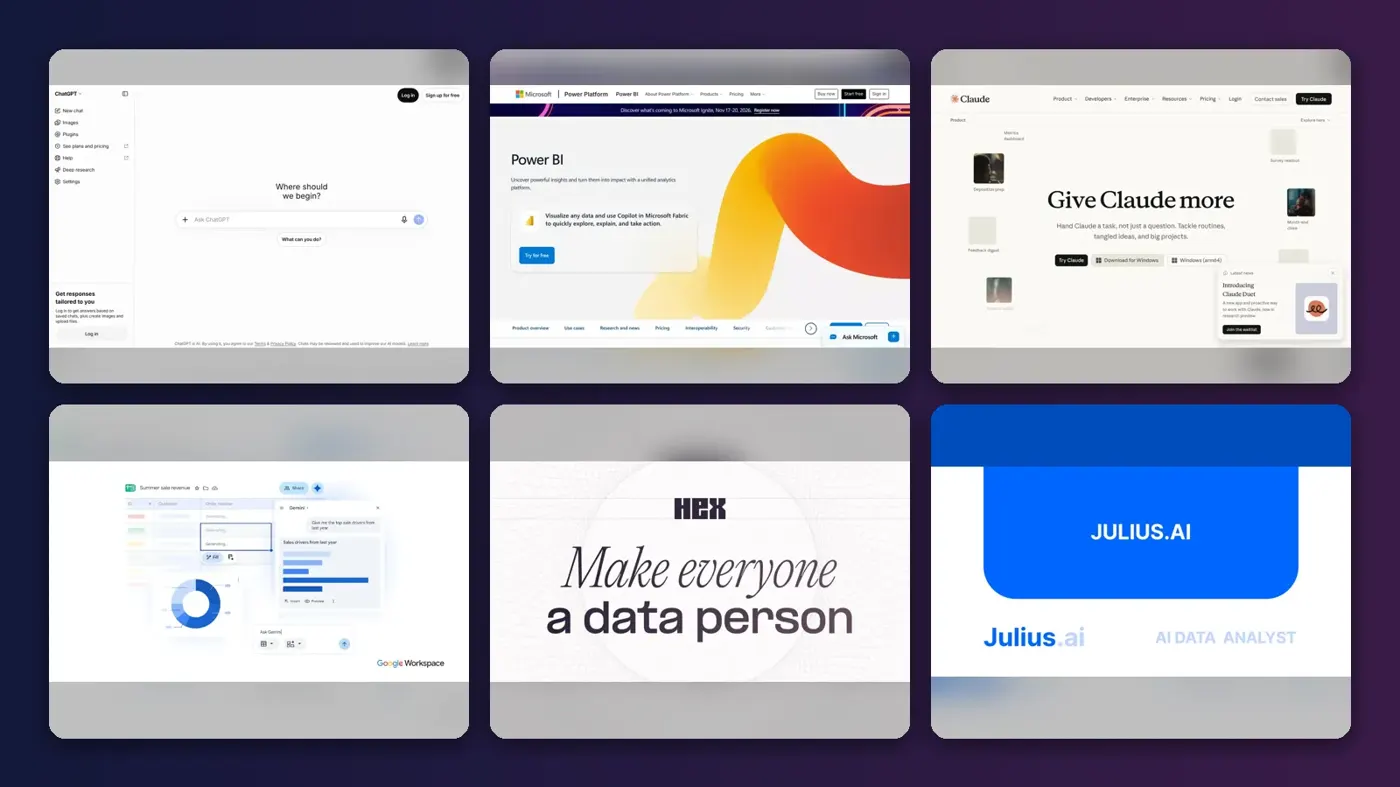
Short answer: if you want one of the best AI tools for data visualization and you are not sure where to start, start with ChatGPT. Upload a spreadsheet, ask a question in plain English and it writes and runs Python to build the chart for you. If your company already lives in Microsoft 365, Power BI with Copilot is the better long-term bet, and Tableau still wins when you need deep visual analysis.
Everything else on this list is a specialist. Below are eight AI data visualization tools ranked by how well they turn raw numbers into charts people can actually read, with prices checked in October 2026.
Key takeaways
- Chat assistants are the fastest start. ChatGPT and Claude can turn a CSV into a chart in one prompt, with no setup and plans from $8 to $20 a month.
- BI platforms are for sharing, not just making. Power BI and Tableau cost more per seat, but they give you live dashboards, refresh schedules and permissions.
- Budget per reader, not per builder. On Power BI and Tableau, every person who views a shared dashboard usually needs a paid license.
- Check the credit system before you pay. Julius, Napkin and Hex all meter AI use with credits, and running out mid-project is the most common complaint.
How we ranked them
Nobody at The AI Future ran hands-on tests for this roundup, and we have no original screenshots. We compared each tool using official product pages, help docs and pricing pages, plus independent pricing breakdowns and verified user reviews on sites like Capterra and Trustpilot, as of late October 2026. We scored each tool on six criteria:
- Chart quality: how readable and accurate the visuals are, based on vendor docs and user reviews.
- Natural-language control: whether you can ask for a chart in plain English and refine it by chatting.
- Data connections: files only, or live links to databases and warehouses.
- Sharing: how easily others can view, filter and reuse what you build.
- Price transparency: whether you can see what you will pay before you talk to sales.
- User sentiment: what verified reviewers praise and complain about.
Prices are in US dollars and can change by country, billing cycle and promotions. Always check the vendor page before you buy.
The 8 best AI tools for data visualization at a glance
| # | Tool | Category | Best for | Free tier | Starts at |
|---|---|---|---|---|---|
| 1 | ChatGPT | AI assistant | Quick charts from any file | Yes | $8/mo |
| 2 | Microsoft Power BI | BI platform | Microsoft 365 teams | Yes (limited) | $14/mo |
| 3 | Tableau | BI platform | Deep visual analysis | Yes (limited) | $75/mo |
| 4 | Claude | AI assistant | Interactive dashboards from a chat | Yes | $20/mo |
| 5 | Gemini in Google Sheets | Spreadsheet AI | Google Workspace users | No | $19.99/mo |
| 6 | Hex | Data workspace | Data teams using SQL and Python | Yes | $36/mo |
| 7 | Julius AI | AI data analyst | Non-technical analysts | Yes (limited) | $20/mo |
| 8 | Napkin AI | Text-to-visual | Diagrams and charts for slides | Yes (limited) | $12/mo |
Tableau's price is for a Creator seat, the license that can build dashboards. Gemini in Sheets needs an eligible Google Workspace or Google AI plan; the $19.99 figure is Google AI Pro.
The best AI data visualization tools in 2026, ranked
ChatGPT – best for quick charts from any file
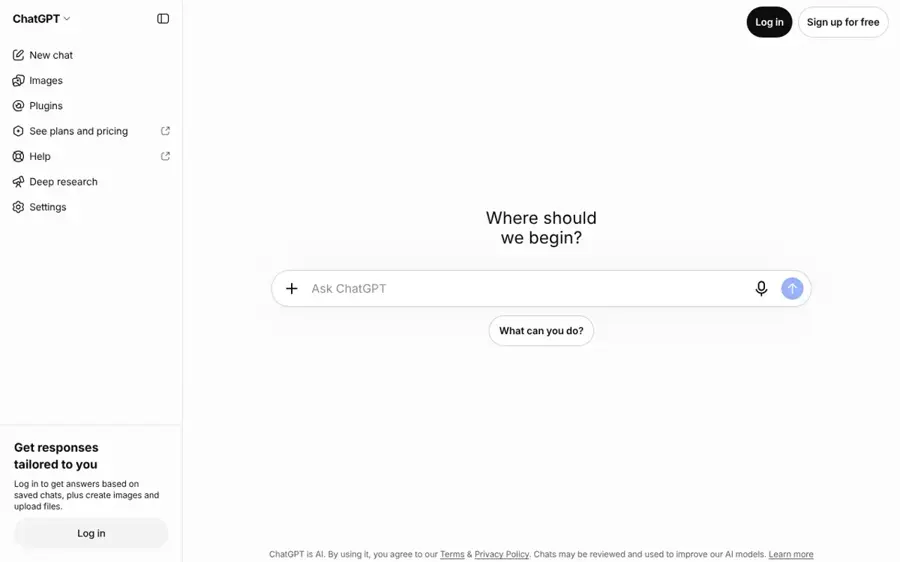
ChatGPT is OpenAI's general AI assistant. Upload a spreadsheet or PDF, describe the chart you want, and it builds it with code it writes and runs itself.
Why it stands out
Most people should start here. OpenAI's help center says ChatGPT can summarize trends and outliers, create charts from uploaded data and run Python-based calculations, working in a notebook-style environment behind the scenes. It accepts .xls, .xlsx, .csv, JSON and PDF files, and can pull files from Google Drive, OneDrive and SharePoint where those connections are turned on.
The charts are good enough for a team update, and you can refine them by simply asking ("make the bars horizontal, sort by revenue"). OpenAI notes that bar, line, pie and scatter charts can be switched to an interactive view; other chart types come back as static images.
Key features
- File analysis: spreadsheets, PDFs and data files up to your plan's upload limits.
- Code you can inspect: every chart is backed by Python you can read and adjust.
- Interactive charts: bar, line, pie and scatter charts can switch to an interactive view.
- Cloud file connections: attach files from Drive, OneDrive or SharePoint when enabled.
Pros
- Fastest route from a CSV to a chart
- Works for almost any file format
- Cheap entry price with a $8 Go tier
- Shows its working, so you can check the maths
Cons
- The analysis sandbox cannot make external web requests, so you must upload the data
- Charts are one-off images, not live dashboards
- Usage limits on lower tiers can cut a long session short
ChatGPT pricing: Free → paid plans from $8/month for Go, with Plus at $19.99 in the App Store listing and $20/month on the web, according to CometAPI's 2026 pricing guide (checked October 2026). See pricing
Related: ChatGPT with GPT-6 review Best ChatGPT alternatives
Verdict: the best first stop for one-off charts, and the cheapest way to learn what AI visualization can do.
Microsoft Power BI – best for Microsoft 365 teams
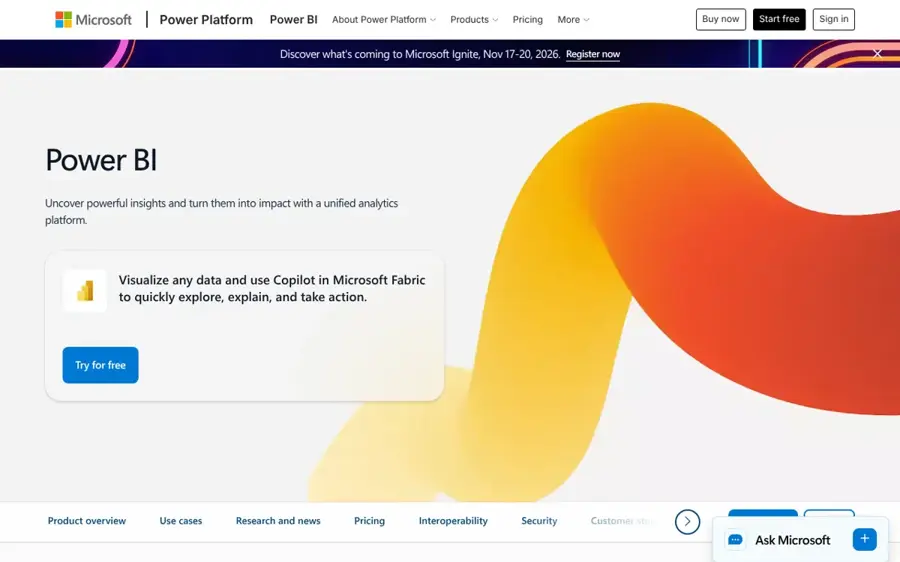
Microsoft Power BI is Microsoft's business intelligence platform, with Copilot built in to answer questions about your data and build visuals on request.
Why it stands out
If your company runs on Excel, SharePoint and Teams, Power BI is the obvious choice. Microsoft says Copilot lets business users quickly create and analyze visuals, get summaries of entire reports and ask for ad-hoc analysis, while report authors can use it to write DAX formulas. The catch is that Copilot needs paid Fabric capacity (F2 or higher) or Power BI Premium (P1 or higher); trial capacities and free SKUs are not supported.
Users rate it highly. Power BI holds 4.6 out of 5 from 1,896 reviews on Capterra, where one financial services user praised "the ability to create interactive dashboards, automate reporting, and build data models using Power Query and DAX." Another reviewer on the same page warned that the licensing model "can be confusing", which matches what we found.
Key features
- Copilot chat: ask questions of a report and get answers, summaries and new visuals.
- DAX help: Copilot can generate formulas for advanced report creators.
- Free Desktop app: build reports locally at no cost.
- Wide connectors: pull from cloud platforms, databases, spreadsheets and business apps.
Pros
- Cheapest serious BI license on a per-seat basis
- Deep fit with Microsoft 365
- Strong user ratings on Capterra
- Free Desktop app for building
Cons
- Copilot needs Fabric capacity on top of seat licenses
- Every report reader needs a paid license unless you buy large capacity
- Licensing tiers are confusing
Microsoft Power BI pricing: Free Desktop → Pro at $14 per user/month and Premium Per User at $24, both paid yearly, per SuperDupr's October 2026 breakdown of Microsoft's page (checked October 2026). Copilot capacity is billed separately. See pricing
Related: Microsoft AI review
Verdict: the default for Microsoft shops, as long as you budget for Copilot capacity and reader seats.
Tableau – best for deep visual analysis
Tableau is Salesforce's analytics platform, known for flexible, polished visuals, with AI features such as Pulse metric digests and Tableau Agent.
Why it stands out
Tableau remains the tool analysts reach for when they need to slice data ten ways and make it look good. One Capterra reviewer noted that "The variety of built-in visualisations is strong too; things like heat maps, scatter plots with trend lines, and geographic maps are easy to set up." Tableau holds 4.6 out of 5 from 2,364 reviews there.
The AI layer depends on what you buy. According to SuperDupr's October 2026 pricing review, Tableau Pulse, which flags unusual changes in email or Slack, is included from the Standard edition. Tableau Agent, the conversational AI, is a Cloud+ feature, and Tableau Next sits in the Tableau+ Bundle; both are sold through sales with no public price.
Key features
- Visual depth: heat maps, trend lines, geographic maps and more out of the box.
- Tableau Pulse: automated metric digests that flag unusual changes.
- Tableau Agent: conversational AI in Tableau Cloud+ (sales-priced).
- Python and R: integrates with both for advanced analysis.
Pros
- Best-in-class chart flexibility
- Pulse included from the Standard tier
- Large, mature user community
Cons
- Annual contracts only, no monthly plan
- Conversational AI costs extra and is unpriced
- More expensive than Power BI for most team sizes
Tableau pricing: Free Desktop edition → Creator at $75, Explorer at $42 and Viewer at $15 per user/month on Standard, billed annually, per SuperDupr (checked October 2026). See pricing
Verdict: worth the premium if someone on your team does serious visual analysis every week.
Claude – best for interactive dashboards from a chat
Claude is Anthropic's AI assistant. It can analyze uploaded files and build charts, dashboards and small interactive tools as shareable artifacts.
Why it stands out
Where ChatGPT gives you a chart, Claude can give you a small app. Anthropic's help center says Claude can make documents, diagrams, dashboards and small interactive tools that open beside the chat, can be edited and shared. A Dashboards template is in beta on Pro and higher plans, and paid users can connect apps to an artifact and store data in it.
That makes Claude a strong pick for a quick KPI page you want to share with a link, though it lacks the refresh schedules and permissions of a BI tool.
Key features
- Artifacts: charts and dashboards open next to the chat and can be shared.
- Dashboards template (beta): a starting point for data pages on paid plans.
- Code execution: creates and edits files to run analysis.
- Connectors: link your apps to bring your own data into the conversation.
Pros
- Builds interactive dashboards, not just static images
- Artifacts are available on the free plan
- Easy to share results with a link
Cons
- Dashboards template needs a paid plan
- Not a replacement for governed BI reporting
- Usage limits reset every five hours
Claude pricing: Free → Pro at $20/month ($17 billed annually), per BenchLM's October 2026 summary of Anthropic's pages (checked October 2026). See pricing
Related: Claude AI review
Verdict: pick Claude when you want a shareable, interactive view of your data in minutes.
Gemini in Google Sheets – best for Google Workspace users
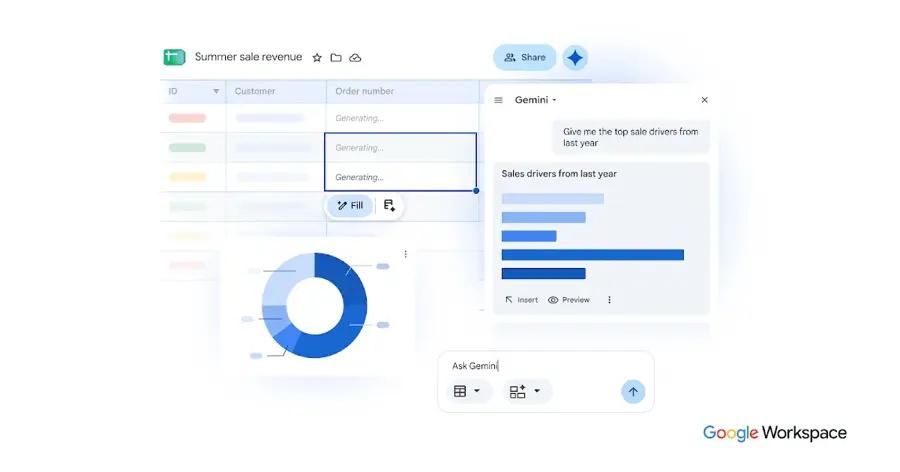
Gemini in Google Sheets is Google's AI assistant built into Sheets, able to build charts, tables, formulas and pivot tables from a side panel.
Why it stands out
If your data already lives in Sheets, this is the least effort option. Google's help page says Gemini can build charts and graphs, generate data analysis and insights, create pivot tables and apply conditional formatting, and even chat about large datasets in BigQuery. You open the Ask Gemini panel, type a request and insert the result straight into your sheet.
Google says it works best with native Sheets files, and your chat history disappears when you reload the spreadsheet, so insert anything you want to keep.
Key features
- Charts on request: build charts and graphs from a prompt in the side panel.
- Pivot tables and formulas: create them without remembering syntax.
- BigQuery chat: analyze large datasets connected to Sheets.
- Multi-tab prompts: focus Gemini on specific tabs or tables.
Pros
- Works inside a tool you already use
- No new app or data upload needed
- Can take actions, not just suggest them
Cons
- Needs an eligible Workspace or Google AI plan
- Chat history is lost when you reload
- Best with native Sheets files, not Excel
Gemini in Google Sheets pricing: No free plan for this feature → requires an eligible Google Workspace or Google AI plan; Google AI Pro is $19.99/month in the App Store listing (checked October 2026). See pricing
Verdict: the easiest upgrade for Google Workspace teams who chart in Sheets every day.
Hex – best for data teams using SQL and Python
Hex is a collaborative analytics workspace that combines SQL and Python notebooks, an AI agent and shareable data apps.
Why it stands out
Hex is built for analysts who already write code but want AI to speed them up. Its Capterra profile describes agentic notebooks with SQL, Python, no-code and AI support, natural-language questions for non-technical colleagues, and interactive dashboards published from the same workspace.
G2's AI summary of user reviews says reviewers frequently mention the ease of use, the seamless integration of SQL and Python, the helpful AI agent and the ability to share interactive dashboards. The same summary notes complaints about performance on large datasets and occasional inaccuracies in analysis.
Key features
- Hex agent: AI help inside notebooks on Community and Professional plans.
- Data apps: turn an analysis into an interactive dashboard.
- Warehouse connections: connects to major data warehouses, dbt and GitHub.
- Compute included: medium compute comes with paid plans; larger profiles are billed per minute.
Pros
- One place for code, AI and dashboards
- Free Community plan to start
- Transparent per-editor pricing
Cons
- Built for people comfortable with SQL
- Users report slowdowns on large notebooks
- AI use is metered by credits
Hex pricing: Free Community plan → Professional from $36 per editor/month and Team at $75, per PricingSaaS (checked October 2026). See pricing
Verdict: the best pick on this list for a data team that wants AI without giving up code.
Julius AI – best for non-technical analysts
Julius AI is an AI data analyst: upload a file or connect a database, ask a question, and it returns charts and tables.

Why it stands out
Julius is aimed squarely at people who need answers from data without writing code. Its pricing page lists connections to Snowflake, BigQuery, MySQL, PostgreSQL and SQL Server, plus Google Drive, OneDrive and SharePoint for teams, and says it builds a semantic layer of your schema so it can work across large databases.
User sentiment is the big caveat. Julius has a TrustScore of 1.7 from 22 reviews on Trustpilot, where one May 2026 reviewer wrote: "The credits disappear ridiculously fast." Julius has not invited reviews there, so the sample may not be representative, but it is worth watching your credit usage closely if you try it.
Key features
- Chat with data: ask questions in plain English and get charts back.
- Database connectors: Snowflake, BigQuery, Postgres and more.
- Semantic schema learning: narrows large databases to relevant tables.
- Scheduled runs: repeat an analysis on a schedule.
Pros
- No coding required
- Live database connections
- Daily free credits to try it
Cons
- Poor Trustpilot rating, mostly about credits
- Credit-based pricing is hard to predict
- Pricing has changed several times this year
Julius AI pricing: Free daily credits → Plus from $20/month ($16 billed annually), per eesel AI's 2026 pricing guide (checked October 2026). See pricing
Verdict: useful for non-coders, but start on the free tier and track credits before committing to a year.
Napkin AI – best for diagrams and charts for slides
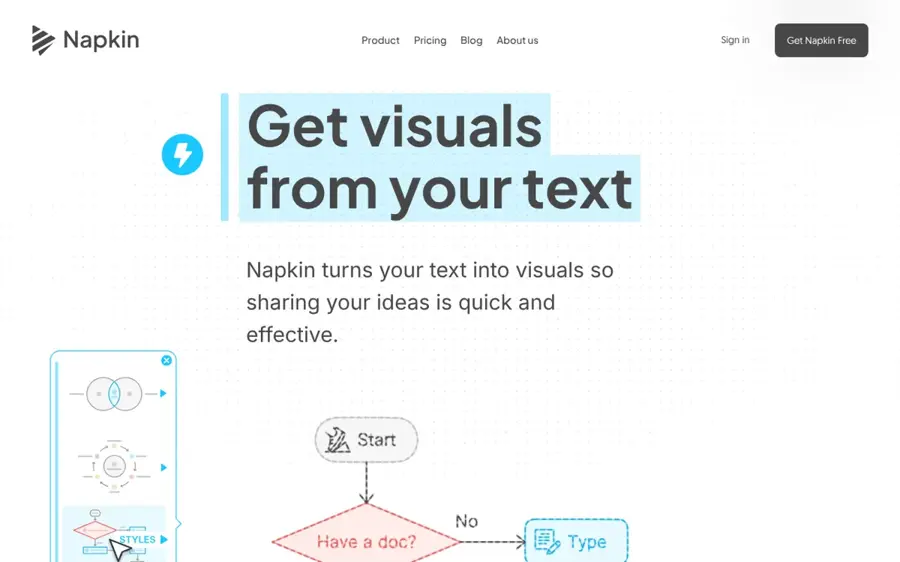
Napkin AI turns pasted text into visuals such as infographics, flowcharts, mind maps and data charts that you can edit and export.
Why it stands out
Napkin is not a data analysis tool. It is a communication tool. You paste text, select a passage and pick from suggested visuals, which Napkin says covers infographics, diagrams, mind maps, flowcharts, data charts and more. Visuals export as PNG, PDF, PPT or SVG.
A Techpresso review based on Napkin's October 2026 pricing calls the free plan "a trial, not a publishing tool, because every exported visual carries the Napkin logo." Plus removes the logo and adds PPT and SVG export, which is what most business users will need.
Key features
- Text to visual: no prompt writing; it works from your own text.
- Full editing: change colours, icons and shapes without spending credits.
- Brand styles: three on Plus, unlimited custom branding on Pro.
- Exports: PNG and PDF on Free, plus PPT and SVG on paid plans.
Pros
- Cheapest paid plan on this list
- Great for slides, blogs and reports
- Edits do not use credits
Cons
- Not built for analyzing raw datasets
- Free exports carry Napkin branding
- Free credits reset weekly with no rollover
Napkin AI pricing: Free (500 credits a week) → Plus at $12 per person/month or about $9 billed annually, per DailyFix and Techpresso (checked October 2026). See pricing
Related: Napkin AI review Gamma AI review
Verdict: the right tool for turning ideas and summary numbers into clean visuals for a deck.
How to choose the right AI tools for data visualization
Start with where your data lives
If your numbers sit in Sheets, try Gemini first. If they sit in Excel and SharePoint, look at Power BI. If they sit in a warehouse like Snowflake or BigQuery, Hex or Julius will save you the export step. Choosing a tool that reads your data directly removes the most friction.
Decide whether you need a chart or a dashboard
A one-off chart for a slide is a ChatGPT or Napkin job. A dashboard that refreshes every morning and that 20 people check is a Power BI or Tableau job. Claude sits in between: interactive and shareable, but without enterprise refresh and permissions.
Count your readers before you count your builders
BI tools charge for viewers. SuperDupr's math shows a 25-person team where everyone views reports pays $350 a month on Power BI Pro, while a similar Tableau team pays about $576 a month on Standard. If most people only need five numbers, a cheaper assistant plus a shared link may be enough.
Always check the AI's working
AI charts can look right and still be wrong. Both OpenAI and Microsoft advise reviewing outputs, and Microsoft warns that an unprepared data model can produce generic or inaccurate answers. Ask the tool to show its code or formula, and spot-check one number by hand. Our guide to writing better AI prompts helps you ask for exactly the chart you want.
Choose ChatGPT if you need quick charts from files and want the lowest cost. Choose Power BI if you are a Microsoft 365 company that needs shared dashboards. Choose Tableau if visual depth matters more than price. Choose Hex if your team writes SQL. Choose Napkin if your end product is a slide, not a spreadsheet.
Free vs paid: what you actually get
Most AI data visualization tools have a free tier, but each one holds back something different. Here is what the free versions leave out.
| Tool | What free gets you | What you pay for |
|---|---|---|
| ChatGPT | Limited messages and file uploads | Higher limits and more analysis from $8 (Go) or $20 (Plus) |
| Power BI | Desktop app; build reports for yourself | Publishing and sharing from $14 per user |
| Tableau | Desktop Free Edition on local files | Publishing to Tableau Cloud from $75 per Creator |
| Claude | Artifacts, including charts | Dashboards template, connectors and data storage from $20 |
| Hex | Community plan | More editors, credits and features from $36 per editor |
| Julius AI | Daily credit allowance | Frontier models and more credits from $20 |
| Napkin AI | 500 credits a week, branded exports | Logo removal and PPT/SVG export from $12 |
Free plans are good for testing whether a tool understands your data. You pay once you need to share, remove branding or work at volume. Power BI is the clearest example: Microsoft's free account cannot share reports, so it is a personal tool until you buy Pro.
For a solo user, $20 a month on ChatGPT Plus or Claude Pro covers most charting needs. For a team, the bill depends on how many people read the output, so do that math before you sign an annual contract. If you want the bigger picture on where this is heading, read our explainer on generative AI data analytics and our take on whether data analysts will be replaced by AI.
Final verdict
If you only pick one, pick ChatGPT. It handles the widest range of files, it is cheap, and it shows its working. Upgrade to Power BI when you need shared, refreshing dashboards inside Microsoft 365, or Tableau when the visuals themselves are the product. Claude is the best choice for quick interactive dashboards, Hex for data teams, and Napkin for anyone who just needs a clean chart on a slide. Treat Julius with care until its credit complaints settle down.
FAQ
Which AI tool is best for data visualization?
For most people, ChatGPT is the best AI tool for data visualization because it turns uploaded spreadsheets into charts from a plain-English request, starting at $8 a month. Teams that need shared, refreshing dashboards should choose Power BI with Copilot or Tableau. Data teams that write SQL will get more from Hex.
Can AI create charts from Excel files?
Yes. ChatGPT accepts .xls, .xlsx and .csv files and writes Python to build charts from them. Claude and Julius AI also analyze uploaded spreadsheets. Gemini works inside Google Sheets, so Google recommends saving an Excel file as a Google Sheet first. Power BI connects to Excel directly.
Is there a free AI tool for data visualization?
Several. ChatGPT and Claude have free plans that can make charts, Hex has a free Community plan, and Napkin AI offers 500 credits a week. Power BI Desktop and Tableau Desktop Free Edition are free for personal use, but sharing dashboards with others requires a paid license.
Is AI-generated data visualization accurate?
Usually, but not always. AI tools can misread columns or pick the wrong calculation. OpenAI advises reviewing the code and assumptions behind any analysis, and Microsoft says an unprepared data model can return generic or inaccurate answers. Check at least one figure by hand before you share a chart.
Sources
- Data analysis with ChatGPT (OpenAI Help Center)
- ChatGPT Pricing 2026: Free vs Go vs Plus vs Pro (CometAPI)
- ChatGPT App (Apple App Store)
- Power BI: Pricing Plan (Microsoft)
- Power BI Pricing 2026: Pro vs Premium Per User (SuperDupr)
- Copilot for Power BI overview (Microsoft Learn)
- Microsoft Power BI Reviews 2026 (Capterra)
- Tableau Pricing 2026: Creator, Explorer and Viewer Costs (SuperDupr)
- Tableau Reviews 2026 (Capterra)
- Plans & pricing (Claude by Anthropic)
- What are artifacts and how do I use them? (Claude Help Center)
- Claude pricing plans (BenchLM)
- Collaborate with Gemini in Google Sheets (Google Docs Editors Help)
- Google AI Pro & Ultra plans (Google)
- Google Gemini App (Apple App Store)
- Hex Pricing: Plans for Every Data Team (Hex)
- Hex Pricing: Free plan, from $36/editor/mo (PricingSaaS)
- Hex Reviews & Product Details (G2 AI)
- Hex Pricing, Cost & Reviews (Capterra UK)
- Julius AI Pricing: Compare Free and Paid Plans (Julius AI)
- A complete guide to Julius AI pricing in 2026 (eesel AI)
- Julius Reviews (Trustpilot)
- Pricing (Napkin AI)
- Is Napkin AI Worth It in 2026? (Techpresso)
- Napkin AI Pricing 2026: The Watermark Catch (DailyFix)