Placer AI review 2026: what it is, pricing, accuracy and alternatives
Placer AI estimates foot traffic for stores and properties. We cover how it works, quote-only pricing, the end of free sign-up, accuracy limits and alternatives.
 Written byFahad HashmiContributing writer, AI in energy and industry
Why you can trust The AI Future
Our writers research every product, link each claim to its source and correct mistakes openly. Companies can't pay for coverage or see reviews before they're published.
Read our editorial policy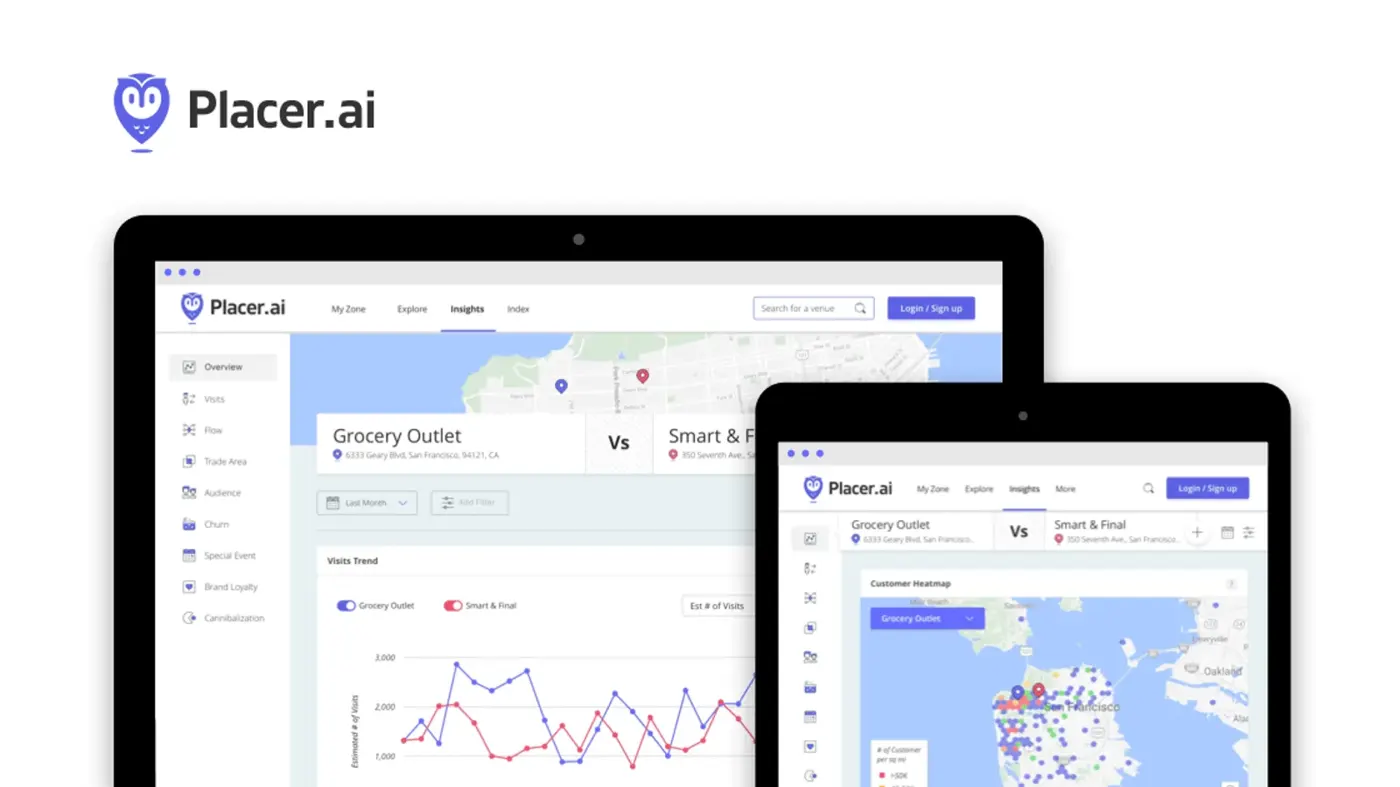
Our verdict on Placer.ai (Placer Labs)
Placer AI is a strong directional foot traffic tool for US commercial real estate, retail and civic teams with enterprise budgets. Skip it if you need exact counts, transparent methodology, global coverage or self-serve pricing.
Pricing Custom quote-only subscriptions; freemium dashboard sign-up no longer promoted as of late October 2026
Visit Placer.ai (Placer Labs)Here is the short version. Placer AI (officially Placer.ai) is a location intelligence platform that estimates how many people visit a store, mall, office or event venue, where they came from and where they went next. It is built for commercial real estate teams, retailers, restaurant chains, consumer brands and city governments, and it sells on custom, quote-only subscriptions. If you need directional foot traffic data for US properties and have an enterprise budget, it is one of the default choices. If you need exact counts, transparent methodology or a cheap self-serve plan, it is a harder sell.
A note on method: nobody on our team had hands-on access to a paid Placer account for this review, so there are no screenshots or test results of our own here. We compared Placer using its official pages, its published data and privacy policies, third-party pricing trackers, independent analysis and user reviews on Capterra, SaaSworthy and Software Finder, as of late October 2026. Where someone else made a claim, we tell you who.
What is Placer AI?
Think of Placer as a very large, anonymised sample of phones turned into statistics about places. Phones that have opted in to location sharing through partner apps produce location signals. Placer matches those signals to property outlines (it calls them property-level polygons), counts the visits, then extrapolates from its sample to an estimate for the whole population. The output is not "this person went to Target"; it is "this Target got roughly this many visits last month, mostly from these neighbourhoods".
The company was founded by Noam Ben-Zvi (CEO), Zohar Bar-Yehuda, Oded Fossfeld and Ofir Lemel. It launched the platform in 2018, says it has over 4,000 customers and announced it had passed $100 million in annual recurring revenue in February 2024. StartupHub lists $241M in total funding and about 634 people.
So where does the "AI" come in? Two places. First, the extrapolation and categorisation are machine learning models; Placer advertises "+92% accuracy" for its data science, a vendor claim with no published methodology behind the number on that page. Second, Placer is adding generative AI features. In its Responsible AI Principles post, the company says it "doesn't build its own large language models" and instead uses models from leading providers, embedded "whether as an analytical assistant, an automated summary, or a future agent". It did not say which providers or which features are live, so treat the GenAI layer as early. If you want background on how products bolt LLMs onto existing data, our guide to generative AI integration covers the pattern, and what an AI model is explains the basics.
Key features
Foot traffic and visit metrics
The core is visit estimates by property, chain and industry. According to Placer's App Store listing, you can analyse foot traffic across multiple timeframes and look at visit frequency, dwell time and similar metrics, then compare and rank properties at local, state and national level. Placer's own research blog, The Anchor, shows what this looks like in practice: recent posts report, for example, that Shake Shack's Q3 2026 visits rose 18.7% year over year and Taco Bell's fell 10.1% after an outbreak.
Trade areas, demographics and extra data layers
Beyond visit counts, Placer layers in sales estimation, demographics, business counts, planned development, crime, psychographics, consumer expenditures and climate data. This is what turns a visit count into a site selection argument: where visitors live, how they compare with the surrounding population and what else is planned nearby.
Platform, API and data feeds
You get three ways in, per the Placer homepage: the web platform with property, chain and industry reports plus custom reports; an API (Placer calls it PAPI) for pulling data into your own stack; and automated data feeds. One Software Finder reviewer mentions connections to Salesforce and Tableau. If you plan to build your own charts on top, our list of AI tools for data visualization is a useful next stop.
Mobile app
The free iOS app lets subscribers use their phone's location to explore nearby properties on site, which suits brokers walking a property. The app is a front end to a subscription, not a standalone free product.
Privacy controls
Placer's Trust Center says it only provides aggregated data that preserves "K-anonymity of 50", has "never sold user-level data", and blocks reports on places such as military facilities, places of worship, preK-12 schools, rehab centres and women's health facilities. It cites ISO/IEC 27001:2022 certification and an annual SOC 2 Type II attestation.
Pricing and plans
Placer does not publish prices. Its pricing page says packages are customised and asks you to fill out a form. The FAQ there covers seat licences, enterprise licences, one-time reports, student and research licensing, and free trials, but the answers are not shown without interacting with the page.
The free plan is the part that changed this month. PricingSaaS, which tracks vendor pricing pages, recorded on October 26, 2026 that Placer dropped its free sign-up promotion: the "Sign Up Free" button and "Try Placer Free" headings were replaced with Contact Sales calls to action, though a trials FAQ still mentioned freemium. Before that, StartupHub described the freemium version as a "small display of data". In other words, do not plan around a free tier.
| Plan | Price | What you get |
|---|---|---|
| Free / freemium | Free (sign-up no longer promoted) | Limited view of data; public sign-up removed from the site in late October 2026 |
| Custom subscription | Quote only | Platform, reports, data layers; scope set by properties, seats and industry |
| API and data feeds | Quote only | Programmatic access to aggregated data |
Pricing checked October 2026.
Users consistently describe it as expensive. A Capterra reviewer who rated it 5/5 still wrote that "It is expensive but worth the cost", and several Software Finder reviewers say the price puts it out of reach for smaller businesses. For comparison, PricingSaaS lists Esri's entry price at $125 per user per month, billed annually.
Performance and independent testing
We found no recent, published independent accuracy test of Placer's visit counts with methodology, which is itself worth knowing. What exists is user feedback and analysis of it.
A December 2025 analysis by Techraisal, which summarised public discussions including Reddit, describes two camps. One praises Placer for making geospatial data usable without a GIS background. The other questions panel size and representativeness, because Placer does not publish how many devices feed its estimates. Techraisal reports that users find the numbers line up well for busy locations but "drift significantly for small stores, rural areas, or venues with irregular visitation patterns", and concludes the tool is best treated as "a pattern recognition instrument rather than a definitive measurement system".
Reviews on aggregator sites are warmer. Software Finder shows 4.3 out of 5 from 12 reviews, SaaSworthy shows 4.9 out of 5 from 9 ratings, mostly syndicated from G2, and Capterra has just two reviews, both 5/5. Those samples are small and some are incentivised, so weigh them lightly. The recurring themes are useful, though: easy-to-read dashboards and good support on one side; price, a learning curve with "so many chart types and filters", and demographic overviews that one reviewer said gave "very similar results no matter the location polygonned" on the other.
A worked example: reading a visit estimate
Here is a hypothetical to show why scale matters. Say Placer's sample captures a few percent of visitors and it scales up to a full estimate. At a mall with 200,000 monthly visits, a few thousand sampled visits give a stable trend, and a 5% month-on-month change is likely real. At a small shop with 1,500 monthly visits, the sample may be a few dozen devices. Ten extra or missing phones can move the estimate by 20% or more, and that swing is noise, not a trend. The rule of thumb: trust year-over-year comparisons on busy sites, and treat small-site week-to-week moves with suspicion.
Where it breaks
- Small and rural sites: users report less reliable estimates where visit volume is low, per Techraisal.
- Opaque panel: no published device counts, so you cannot calculate your own error bars.
- Visits are not revenue: a busy store can still underperform; foot traffic is a proxy, not a sales figure.
- Coverage: reviewers say coverage is limited by geography and industry; the strongest data is for US commercial properties.
- Blocked categories: by policy you cannot run reports on sensitive places like schools or places of worship, per the Trust Center.
- Pricing friction: no public prices and, since late October 2026, no promoted free sign-up.
Who it's for
| You are... | Fit | Why |
|---|---|---|
| CRE broker or landlord | Strong | Tenant and co-tenancy stories, on-site mobile app, chain rankings |
| Multi-unit retailer or restaurant chain | Strong | Site selection, competitor benchmarking, trade areas |
| City, tourism or events team | Good | Event visitor counts and origin data for grants and planning |
| Data science team | Mixed | API is useful, but the opaque panel limits your own modelling |
| Small business or solo founder | Weak | Quote-only enterprise pricing, no reliable free tier |
If you are a small team looking for general AI help with business tasks rather than location data, our list of AI business assistants will serve you better.
Placer AI alternatives worth considering
- Esri ArcGIS Business Analyst: choose it if you want full GIS mapping with demographic, spending and census data and your own analysis; it has a free trial and published pricing.
- Unacast: choose it if you need global location and foot traffic data delivered as datasets, or if you work outside the US.
- Advan: choose it for raw foot traffic datasets delivered via cloud storage; it says its panel covers 45M US and 65M global devices, which is more disclosure than Placer offers.
Verdict
Placer AI is a mature, widely used foot traffic platform with a clean interface, rich data layers and a serious privacy policy. It is at its best as a directional tool for busy US commercial properties: comparing sites, tracking chains and building a story for landlords, tenants or investors. Its weak points are the ones that matter to analysts: an undisclosed panel, shakier numbers for small sites, and quote-only pricing that just got less accessible with the removal of the promoted free sign-up. We rate it 4 out of 5. Buy it if foot traffic drives decisions worth far more than the subscription. Skip it if you need exact counts, global coverage or a self-serve price.
Curious how other AI products hold up? Read our Google AI Mode review.
FAQ
What is Placer AI?
Placer AI (Placer.ai) is a location intelligence platform that estimates visits to stores, malls, offices and venues from an anonymised panel of mobile devices. Businesses use it for site selection, competitor benchmarking, trade area analysis and event measurement. It serves retail, commercial real estate, restaurants, consumer brands and governments, mainly in the US, and is sold as a custom subscription.
Is Placer AI free?
Not in any practical sense. Placer once promoted a freemium dashboard with a limited view of data, but in late October 2026 it replaced its "Sign Up Free" prompts with Contact Sales buttons, according to PricingSaaS. Paid access is quote-only, and users describe it as expensive, so plan for an enterprise budget.
How accurate is Placer AI?
Placer claims over 92% accuracy for its data science, but it does not publish its panel size or a full methodology. User reports suggest estimates track well at high-traffic sites and drift at small or rural ones. Treat it as a strong directional signal for trends and comparisons rather than an exact count.
Where does Placer AI get its data?
From partners whose apps collect location data with user opt-in or opt-out consent, according to Placer's Trust Center. Placer aggregates the signals, matches them to property outlines and extrapolates to population estimates. It says it never sells user-level data and only shows results that meet K-anonymity of 50.
Does Placer AI use generative AI?
Yes, increasingly. Placer says it does not build its own large language models but embeds models from leading providers into the platform as assistants, automated summaries and, in future, agents. It has published Responsible AI Principles covering bias, transparency, privacy and security, but has not named its model providers.
Ratings around the web
Ratings as of 2 Nov 2026. Scores change over time; follow the links for the latest.
What users are saying
We read about 18 user reviews across Software Finder, SaaSworthy (G2-sourced) and Capterra, plus Techraisal's summary of Reddit and forum discussion. Review-site users were mostly positive about usability and support, with price and accuracy caveats; forum discussion is more sceptical about data reliability, so this small sample likely skews positive.
Common praise
- Easy-to-read dashboards and reports that impress clients
- Useful visitor origin and event data for planning and grants
- Responsive customer support
Common complaints
- Expensive, out of reach for small businesses
- Accuracy and coverage vary by location and region
- Learning curve with many filters and chart types
Based on: Software Finder reviews of Placer.ai, SaaSworthy reviews of Placer, Capterra reviews of Placer.ai, Techraisal analysis of user discussions
What we like
- Rich data layers beyond visits: demographics, trade areas, sales estimates, planned development
- Clean dashboards that non-GIS users can read quickly
- Platform, API and data feeds for different teams
- Strong published privacy policy: K-anonymity of 50, no user-level data sales, ISO 27001 and SOC 2
- Mobile app for on-site property checks
What could be better
- No public pricing and users call it expensive
- Free sign-up removed from the site in late October 2026
- Panel size and methodology not disclosed; small and rural sites are less reliable
- Learning curve with many chart types and filters
Sources
- Pricing Plans | Customized Subscription Packages (Placer.ai)
- Location Intelligence & Foot Traffic Data Software (Placer.ai)
- About Placer.ai | Our Mission and Story (Placer.ai)
- Placer.ai Reaches $100M Annual Recurring Revenue (Placer.ai)
- New Technology, Same Commitment: Our Responsible AI Principles (Placer.ai)
- Trust Center: Our Commitment to Data Privacy (Placer.ai)
- The Anchor: Location Intelligence & Market Insights (Placer.ai)
- Placer.ai App (App Store)
- Placer.ai Pricing History: Free plan (PricingSaaS)
- Placer.ai - Retail - $241M Raised (StartupHub.ai)
- Placer.ai Software Pricing, Alternatives & More 2026 (Capterra)
- Placer.ai Review – Pros, Cons & Features 2026 (Software Finder)
- Placer - Features, Reviews & Pricing (SaaSworthy)
- Placer.ai and the Challenge of Trusting Foot Traffic Numbers (Techraisal)
- ArcGIS Business Analyst (Esri)
- Location Intelligence & Location Data (Unacast)
- Location & Sales Data for Finance, Retail & CRE (ADVAN)